
Sunday 2 December 2012
data logging
1.0 INTRODUCTION TO DATA LOGGING
What is data logging? When a computer is used to automatically record data as it is produced, we say that the computer is being used for data logging. Data logging and recording is a very common measurement application. In its most basic form, data logging is the measurement and recording of physical or electrical parameters over a period of time. The data can be temperature, strain, displacement, flow, pressure, voltage, current, resistance, power, or any of a wide range of other parameters. Real-world data logging applications are typically more involved than just acquiring and recording signals, typically involving some combination of online analysis, offline analysis, display, report generation, and data sharing. Moreover, many data logging applications are beginning to require the acquisition and storage of other types of data, such as recording sound and video in conjunction with the other parameters measured during an automobile crash test.
Until recently, most scientific data gathering systems were based on electromechanical devices such as chart recorders and analogue gauges. The capability to process and analyze this data was rather limited. With the introduction of more powerful computer system’s new doors have been opened for data gathering, logging, processing, and control. There are a few basic components to every computer system which is to be used for data logging. They include a computer, some sensors, an interface or used to connect the sensors to the computer and some software to store and display the information on the computer.
Data that is to be recorder by a data logging system is gathered using sensors. A sensor is a device which measures a physical quantity such as the temperature and then sends a voltage to the computer representing the quantity. There are two types of sensor that are digital and analogue. An interface is put between the sensors and the computer. The interface converts the voltages that the sensors produce into digital signals that the computer understands and protects the computer from dangerous voltages. When an analogue sensor is first connected to the interface it may need to be calibrated. Calibration matches sensor voltages with units that humans can understand. Most data logging software will perform two main functions. They will record data as it is collected, display and analyse data as it is collected and after it has been collected.
Using computers to record data has a number of advantages over recording data manually. The measurements are always taken at the right time. Unlike a human, the computer will not forget to take a reading or take a reading a little bit too late. Apart from that, there will be no error or mistakes when taking the results. Humans tend to make mistakes when taking the results such as parallex errors. The data logging is often more accurate. Furthermore, the devices can be sent to places that human cannot easily get to go. For example, the planet Mars, into the bottom of a volcano or onto a roof of a tall building to get to a weather station. Besides, Graphs and tables of the results can be produced automatically by the data logging software. Unfortunately, this device does have its disadvantages. One of the disadvantages of using data logging system is the initial cost of purchasing the equipment. If the data logging devices is suddenly breaks down or malfunctions, some data could be lost or not recorded. In addition, the devices will only take readings at the logging interval which has been setup. If something unexpected happens between recordings, the data will not be collected.
Data logging is used the world over in a diverse range of applications. Chemists record data such as temperature, pH, and pressure when performing experiments in a lab. Design engineers log performance parameters such as vibration, temperature, and battery level to evaluate product designs. Civil engineers record strain and load on bridges over time to evaluate safety. Geologists use data logging to determine mineral formations when drilling for oil. Breweries log the conditions of their storage and brewing facilities to maintain quality. Data loggers even being used in the racing industry. They are used to record data such as braking points, lap timing and track maps. Other applications of data logging include un attended weather station recording such as wind speed, unattended hydrographic recording such as water level, road-traffic counting, and environmental monitoring.
In our activities, we use the Vernier Wireless Dynamic Sensor System (WDDS) and Vernier Logger Pro software for collecting, displaying, printing, graphing, and analyzing data. The WDDS is a Bluetooth® wireless combination sensor that contains a three-axis accelerometer, a dual-range force sensor, and an altimeter. The following experiment makes use of the wireless feature of the WDDS, providing opportunities to study physics principles without the added compilation that comes from friction due to wired sensors. We decided to use data logger to study the Newton’s Third Law to investigate collisions with crumple zones.
2.0 APPLICATION OF DATA LOGGING IN LEARNING
2.1 EXPERIMENT OF NEWTON’S THIRD LAW TO INVESTIGATE COLLISIONS WITH CRUMPLE ZONES
2.1.1 ENHANCE PHASE
Looking at photographs with car accidents that took place in the 1950’s and accidents in more recent times you had think that engineers have gone backwards and have made vehicle less safety. Early automobile design theories saw extremely rigid bodies that were very resistant during an accident and did not allow too many deformations. As a sequence, all the forces were transferred to the occupants, most of the times this being quite fatal.
Fortunately, auto safety has come a long way in the last few decades, and of the most effective innovation is the crumple zone, or also know as a crush zone. What is crumple zones? Crumple zones are areas of a vehicle that are designed to deform and crumple in a collision. This absorbs some of the energy of the impact, preventing it from being transmitted to the occupants. Of course, keeping people safe in auto accidents is not as simple as making the whole vehicle crumple. Engineers have to reconsider many factors in designing safer cars, including vehicle size and weight, frame stiffness and the stresses the car is likely to be subjected to in a crash.
Like it or not, physics has the explanation as to why crumple zones are necessary. Isaac Newton’s law states that an object in motion will stay in motion with the same speed and direction unless acted upon by an unbalance force. Another law stated that force is equals to mass multiplied by acceleration. If translated to our situation means that force experienced by the automobile and its occupants decrease if the time required by the vehicle to stop increase.
Crumple zones keep occupants safer in several ways. A crumple zone is designed to deform upon impact so that the energy from the crash is transferred into the body work, rather than being transmitted into the body of occupants. It is also designed so that deformation of the cabin area will be limited. Put in a very simple terms this is achieved by strengthening the inner cabin area of the design and making the outer body parts “softer”. In a secondary sense, it also helps slow down any accident, which in turns helps occupant safety and driver recovery. It delays the collision. Instead of having two rigid bodies instantaneously colliding, crumple zones increase the time before the vehicle comes to a halt.
What is in a crumple zone? The specifics of crumple zone designs are usually proprietary information that auto makers are reluctant to divulge. They can vary widely, depending on the size and weight of the vehicle. Designers have to strike a balance between too much impact resistance and too little impact resistance. Simple designs can include frame segments built to bend in certain areas or collapse onto themselves. More advanced designs can utilize a variety of metals and other materials carefully engineered to absorb as much kinetic energy as possible.
In our experiment, we are going to find out how crumple zone helps in a crash and what crumples zone are made out of.
2.1.2 EMPOWER PHASE
Title : Newton’s Third Law-Investigating Collisions with Crumple Zones
Introduction :
You may have learned this statement of Newton’s third law: “To every action there is an equal and opposite reaction.” What does this sentence mean? Unlike Newton’s first two laws of motion, which concern only individual objects, the third law describes an interaction between two bodies. For example, what if you pull on your partner’s hand with your hand? To study this interaction, you can use two Force Sensors. As one object (your hand) pushes or pulls on another object (your partner’s hand) the Force Sensors will record those pushes and pulls. They will be related in a very simple way as predicted by Newton’s third law. The action referred to in the phrase above is the force applied by your hand, and the reaction is the force that is applied by your partner’s hand. Together, they are known as a force pair. This short experiment will show how the forces are related.
Objectives :
In this activity, you will
• simulate collisions with and without crumple zones.
• simulate collisions with differing quantities of crumple zones.
• investigate the effectiveness of a crumple zone
Material:
Computer
10 heavy-duty aluminum foil strips, 3 × 10 cm
Logger Pro Software
Vernier Wireless Dynamics Sensor System
10 standard aluminum foil strips, 3 × 10 cm
glue stick
dynamics cart and track with 500 g mass
meter stick or measuring tape
PASCO force sensor
Procedure :
Establish a connection to your WDSS
1. Turn on the WDSS. Note the name on the label of the device.
2. Make sure Bluetooth is activated on your computer. Some computers have Bluetooth built into them. If that is the case, make sure Bluetooth is turned on.
3. Start Logger Pro.
4. Establish a wireless connection with the WDSS.
a. Choose Connect Interface from the Experiment menu. Choose Wireless and then Scan for Wireless Device.
b. There will be a short delay while Logger Pro attempts to establish a connection. If the WDSS is not found, try scanning again.
c. A dialog box will appear showing your WDSS on the list of available devices. Select your WDSS device and then click . Once a connection is made, the two LEDs on the WDSS will be lit green.
Sensor and Data Collection Setup
5. Choose Set Up Sensors from the Experiments menu and then select your WDSS device. Set up the sensors so that only the x-axis accelerometer is active.
6. Choose Data Collection from the Experiment menu. Adjust the data collection experiment length to 1 second with a sampling rate of 250 samples/second.
Click on the Triggering tab and set up triggering as shown.
7. Set up the dynamics cart and track using one set of the adjustable leveling feet to create a slight incline. Attach the track end stop to the lower end of the track and place that end against a wall or firm surface that will prevent the track from moving during the experiment. Adjust the end stop so it is positioned at the 7 cm mark on the track.
8. Mount the WDSS on top of the cart as shown in Figure 1 below. Arrange the cart and WDSS so that the x-axis accelerometer is pointing towards the track’s end stop. With the cart in place and not moving, click to zero the x-axis accelerometer.
9. Attach the 500 g mass to the WDSS. For more stability, place the mass toward the center of the car.
10. Roll each strip of aluminum foil into a cylinder. Attach the two edges together using glue from the glue stick. Each cylinder should be 3 cm in height. Be sure you know which cylinders are heavy-duty and which are standard aluminum foil.
Simulating Collisions using Heavy-Duty Aluminum Foil
11. Position the front edge of the cart at the 60 cm mark on the track. The cart will be 53 cm from the end stop. Click to begin data collection. Release the cart and allow it to collide with the end stop. The collision will have triggered data collection.
12. Once data collection is complete, review the data to find the magnitude of the largest acceleration associated with stopping the WDSS. Record this value in the data table provided. Determine the time it took for the cart to stop its forward progress and record this value in the data table provided.
13. Position one foil cylinder so that it is centered on the track with the base of the cylinder against the track’s end stop. Repeat Steps 11 – 12 using the foil cylinder as a crumple zone. Note the condition of the cylinder after the collision.
14. Repeat Step 13 using two foil cylinders placed side by side.
15. Repeat Step 13 using three foil cylinders placed side by side.
16. Repeat Step 13 using four foil cylinders placed side by side.
Simulating Collisions using Standard Aluminum Foil
17. Repeat Steps 13 – 16, this time using standard aluminum foil cylinders in place of the heavy-duty foil.
RESULTS
Maximum Stopping Acceleration (m/s )
|
Time to stop
(s)
| |
Without Crumple Zones
|
>60
|
0.005
|
With Crumple Zones
|
Heavy- Duty Aluminium Foil
|
Standard Aluminium Foil
| ||
Maximum Stopping Acceleration
(m/s )
|
Time to stop
(s)
|
Maximum Stopping Acceleration
(m/s )
|
Time to stop
(s)
| |
1 Foil Cylinder
|
9.40
|
0.113
|
>60
|
0.728
|
2 Foil Cylinder
|
9.47
|
0.064
|
6.28
|
0.120
|
3 Foil Cylinder
|
14.44
|
0.050
|
7.25
|
0.092
|
4 Foil Cylinder
|
15.26
|
0.047
|
7.80
|
0.070
|
Discussion :
Question
1. What is the relationship between the maximum stopping acceleration and the maximum stopping. Force experienced by the cart? What physics principle is the relationship based on?
2. What is the relationship between the maximum stopping acceleration and the time it takes the cart to stop? What physics principle is the relationship based on?
3. What is the relationship between the number of cylinders and the maximum stopping acceleration for the heavy-duty foil? Does this same relationship hold for the standard foil? Explain.
4. Based on your data, which crumple zone was the most effective? Which was the least effective? Explain your reasoning.
Answer to questions
1. The maximum acceleration and force are directly related. As one goes up so does the other. This is Newton’s 2nd Law.
2. The maximum acceleration and time to stop the cart are inversely related. As the maximum acceleration increases, the time to stop the cart decreases. This is based on the impulse-momentum theorem. Given the carts all have the same change in momentum, they all require the same impulse to stop the cart. The cart with the largest average acceleration will stop in the shortest amount of time.
3. Answers will vary. For our data, as the number of cylinders increased, the maximum acceleration increased. This is a result of the increased “stiffness” of the crumple zones. This was not the case for the standard foil where a single cylinder was not able to significantly slow the cart before it impacted the end stop. For two or more cylinders, the results were similar to the heavy-duty foil.
4. Answers will vary. From our data, the best crumple zone was the two cylinder, standard foil crumple zone. This had the smallest maximum stopping acceleration and the longest stopping time. The worse crumple zone was the single cylinder standard foil. The cylinder was completely flattened, allowing the cart to impact the end stop with a force comparable to the collision without a crumple zone.
2.1.3 ENHANCE PHASE
Based on the problem statement in engage phase, everyone always want to know how does the crumples zone works and what is involves in the crumple zone activity and the relationship between them. Besides, they also want to know what types of material used to make the most effective crumple zone. Actually, often these accidents are caused by dangerous driving or by drivers who are drunk. Sometimes they are caused by driver error. But no matter how carefully you drive, someone else can always run into you or you may need to stop suddenly in an emergency. It is because, when cars move, they have lots of kinetic energy. When they stop they have no kinetic energy at all. Controlling this transfer of energy is crucial for passengers’ safety. When the car brakes, the energy is transferred through friction into heat in the brakes. The more energy the brakes can transfer each second, the better the brakes are. In a crash the kinetic energy is transferred through work done in changing the shape of the car. It also transferred to heat by friction and a small amount is transferred into sound.
Thus, to solve this problem, cars are fitted with many safety features. They help reduce injuries in a crash. We have air bags, seat belts and crumple zones in our cars but how they work? Crumple zone is designed so that the structure of the car will give way during a collision. The metal of the car will dent, bend and fold during collision. They help reduce injuries by changing shape and absorbing energy through progressive, controlled and reduced acceleration of the vehicle. A good crumple zone will mean that a car stops in a longer time and longer distance. The change in speed remains the same but the deceleration will smaller. The forces needed for this lower deceleration will also be smaller and safer too. This is also true when braking gently. Less braking force is used and cars take longer to stop.
Crumple zones are very important because they reduce the amount of energy transferred to passengers in a vehicle during a collision and the amount of force acting on the passengers during the collision. It is important to realize that crumple zones must follow conservation of momentum and conservation of energy. The momentum change of the vehicle for a given speed is the same as the change in kinetic energy. By increasing the time of the collision and the distance over which the collision occurs, one can reduce the amount of force needed to stop the vehicle. This also reduces the amount of force that acts on the passenger. From the energy approach, energy is needed to deform an object, and if the object is permanently deformed, that energy cannot be retrieved and transferred to the passenger. Energy is also transformed into heat energy when deformation occurs. Because of this, it is important to design crumple zones that will permanently deform and will absorb the energy of the collision.
Air bags can help prevent the driver or the front seat passenger hitting the dashboard. When a car is in a front-end collision at more than 10 to 15 mph, a sensor activates the control system for the air bag. A signal is sent to a small detonator system which produces gas to fill the air bag. The driver or the passenger then hits the air bag instead of the dashboard and the energy is absorbed more safely. The air bag or pillow is made of a flexible fabric such as nylon or polyester that inflates in a head-on collision. Airbag will not deploy if a vehicle is struck from behind, although the airbags in the striking car may go off. The driver’s airbag emerges from the steering wheel, where it is stored. If a vehicle is equipped with a passenger-side airbag, it will deploy from inside the dashboard, where it is stowed. Drivers bags usually are round, while passenger-side airbags are more of a rectangular or box shape.

Then, car seatbelts protect people in two ways during a crash. The seatbelt prevents the person being thrown about in the car, possibly through the windscreen or hitting themselves on the steering wheel or other objects. The seatbelt also stretches a little, while restraining the person. The stretching increases the amount of time it takes the person to stop. Seat belts also absorb passenger inertial energy by being designed to stretch during an impact, again to reduce the speed differential between the passenger's body and their vehicle interior. In short, a passenger whose body is decelerated more slowly due to the crumple zone over a longer time survives much more often than a passenger whose body indirectly impacts a hard, undamaged metal car body which has come to a halt nearly instantaneously.
Then, crumple zone are constructed in many different ways in order to obtain a higher safety rating. Most crumple zones will be constructed with steel or titanium, high density and low density polymeric foam, spaced reinforcing fibres, spaced mechanical ribs and reinforced metal inserts with notched section for predetermined crumpling. Firstly, crumple zone have high density polymeric foam which contains more tightly formed molecules to make the foam strong, this is places in front of the cabin. Secondly reinforced fibres and spaced between the high density polymeric foam and the low density foam. This low density foam has loosely form molecules which give the foams and greater absorbing ability then a hard breaking one. Thirdly the foam is caged in mechanical ribs made from either steel or titanium and have been specifically designed to crush downwards under the car. Lastly, the front end of the car is built with steel or titanium. These metal pieces are reinforced with notched metal inserts which will cause the metal to either crush upwards, downwards or to the side depending on the collision therefore leaving the engine safe for movement and thus the cabin and occupants
.
3.0 CONCLUSION
Data logging will continuously play an important role in education in schools, colleges and universities. As we have discussed earlier, it does have lots of advantages and of course may able to enhance learning process. Many researchers have proved the benefits of using data logging in science teaching. McKenzie & Padilla (1986) have shown that data logging is greatly improves graphing skills of students and helping students to form links with the process of investigating scientific relationship. In addition to that, the skills of real time reporting where the graph is drawn at the same as the experiment is performed, has been shown to encourage reflection and interpretation among students (Brasell, 1985). Special features of data logging graphing software also helped students overcome a variety of difficulties associated with manual method of drawing graphs.
Data logging allows the monitoring of variables within a very small or very large timescale. Computers can capture data much faster and much more frequently than by hand. This allows for greater accuracy and precision. In addition, computers can process enormous amounts of data very rapidly. Valuable teaching time can be taken up with reading instruments and writing lists of data. The use of data loggers makes the capture of this data far less tedious and puts science teaching in a more modern setting as a sequence of readings can now be obtained automatically under the control of computer software. This increases the productivity of the class and encourages higher quality work. As pupils and teachers become confident in the use of sensors and modern programmes, they are encouraged to take decisions and to investigating the results by altering some of the variables in the experiment. More cycles of “predicting and testing of hypotheses” are possible due to ease of capture of data and the saving of time allowed by the data logging approach to science teaching. Weaker students benefit from automated graph drawing as the reduced effort in obtaining graphs, gives pupils of lower ability better access to this visual medium for analysing data. Pupils of higher ability can manipulate the data, present it in a variety of ways, change variables and predict the effect of these changes. In addition they can compare their data with their colleagues and with sample data and go on to discuss why differences exist.
In conclusion, data logging will have a good future in Malaysian education system based on the advantages that they serve to both teacher and students.
4.0 REFERENCES
Properties Of Materials Used in the Construction Of Crumple Zone. Retrieved on December 2, 2012http://scic21crumplezones.wikispaces.com/Properties+of+materials+used+in+the+ construction+of+Crumple+zone
What is data logger. Retrieved on November 29, 2012 from http://www.ni.com/white-paper /2946/en
Data logging. Retrieved on November 29, 2012 from http://www.hollyfield.k ingston.sch.uk/gcseit/GCSE/datalog.htm
PC based data logging and control. Retrieved on November 29, 2012 from http://www.ndt-ed. org/GeneralResources/DataLogging/DataLogging.htm
What are crumple zone. Retrieved on November 29, 2012 from http://www.cars buddy.com.au/crumple-zones
Momentum –Real life Application, Retrieved on December 1, 2012 http://www.scienceclarified. com/everyday/Real-Life-Chemistry-Vol-3-Physics-Vol-1/Momentum-Real-life-applica tions.html#b
Crumples zone, Retrieved on December 1 , 2012 http://www.bbc.co.uk/schools/gcsebitesize/ science/add_gateway_pre_2011/forces/crumplezonesrev1.shtml
Air bag (2012 ), Retrieved on December 2, 2012 http://www.newworldencyclopedi a.org/entry/Air_bag
Stella report
EXPERIMENT PREY-PREDATOR DYNAMIC
OBJECTIVE
- To understand the meaning of simulation
- To understand the purpose simulation use in teaching and learning
- To conduct an experiment by using STELLAR software
- To investigate the predator-prey interactions by using STELLAR software.
INTRODUCTION:
What is simulation? simulation or a model is a program that attempts to simulate an abstract model of a particular system. Besides, simulation is the discipline of designing a model an actual or theoretical physical system, executing the model on a digital computer and analyzing the execution output. Simulation embodies the principle of ‘learning by doing’ to learn about the system we must first build a model of some sort and then operate the model. Besides, simulations build on and useful adjunct to purely mathematical models in science, technology and entertainment.
In recent years interactive media and tools, like scientific simulations and simulation environments or dynamic data visualizations, became established methods in the teaching and learning in subject science. Hence, university teachers of science are faced with the challenge to integrate these media in teaching and learning. However, simulations and dynamic visualizations offer great opportunities for teachers and learners, since they are both illustrative and explorable but simulations bear instructional problems which are, they are abstract, demand some computer skills and conceptual knowledge about what simulations intend to explain. Besides, although simulations cannot replace science classroom and laboratory activities completely, they offer various advantages both for classroom and distance education.
visualizations and interactive laboratory experiences. Simulations make these types of interactive,
authentic, meaningful learning opportunities possible. Learners can observe, explore, recreate and receive immediate feedback about real objects, phenomena and processes. The success of simulations
use in science education depends on how they incorporated into curriculum and how teacher use it. The most appropriate use of simulations seems that use them for a supplementary tools for classroom instruction and laboratory. Multimedia supported, highly interactive, collaborative simulations appealing growing interest because of their potentials to supplement constructivist learning. Besides, simulations also a good tools to improve students’ hypothesis construction, graphic interpretation and prediction skills. Computer simulations have potential for distance education laboratories.
Actually, there are several usage of simulations in science education. Computer simulation instruction will give students the opportunity to observe a real world experience and interact with it. For an example, in science classroom, simulations can play an important role in creating virtual experiments and inquiry. Besides, problem based simulations allow students to monitor experiments, test new models and improve their intuitive understanding of complex phenomena. Simulations are also potentially useful for simulating labs that are impractical, expensive, impossible and too dangerous to run. However, according to researcher, purpose driven simulations can be appropriate tools to eliminate some learning defeciencies. For an example, simulations may be used to scaffold learning of those whose ability of imagining relatively low that is critical to understand the dynamic of systems.
The effectiveness uses of simulations in the science classroom are abundant and as varied as the teachers who use them. Always remember that the technologies like computer simulations are tools to support learning. Thus, there are several way in order to maximize the potential of computer simulations to enhance meaningful in science learning. Firstly, keep instruction students centered. Computer simulation offer the opportunity to engage students in higher level thinking and challenge them to struggle with new ideas. Lessons involving computer simulation should remain students centered and inquiry based to ensure that learning is focused on meaningful understandings, not rote memorization. Depending on instructional objectives and classroom arrangement, the students groupings and computer setups will vary. Then, when simulations are teacher led, students should be actively engaged through questioning, prediction generation, testing and conclusion drawing. This connection made to their own lives make the learning more authentic and meaningful. When students work with simulations individually or in small groups, discussion and collaboration among teachers and peers should be fostered. By encouraging reflection on their action and decision making, teacher can help expose students misconceptions.
Then, teachers should more focus to content, not technology. Although some simulations are extremely user friendly and self explanatory, others require a good deal of time to become familiar with. If students are being them on their own, they must understand how the program operates. Besides, as teachers they should lead the class through the simulations as a demonstration, ensuring the type of student engagement describe previously. Even the simulation is designed for independent student used, be sure to familiarize the students with its features, model its use and provide access to any additional domain knowledge and tools that might facilitate their work. Certainly the most effective type of support and means of providing it are dependent upon the ability and needs of students and the specific learning goals.
There are numerous simulation software packages available such as AnyLogic, Adaptive Modeler, Consideo Modeler, ExtendSim, Insight Maker, isee NetSim, iThink, MapSys, myStrategy, Powersim Studio, Simgua, STELLA, TRUE, Sysdea and Vensim. STELLA, Sustaining Technology Enhanced Learning at a LARge scale, is an EU project represents the effort of the leading instituitions and project in European Technology-Enhanced Learning (TEL) to unify our diverse community. STELLA supports diverse learning styles with a wide range of storytelling features. Diagrams, charts, and animation help visual learners discover relationships between variables in an equation. Verbal learners might surround visual models with words or attach documents to explain the impact of a new environmental policy. There are several uses of STELLA is to simulate a system over time, jump the gap between theory and the real world, enables to creatively change systems and Clearly communicate system inputs and outputs and demonstrate outcomes.
For this project, I have decided to conduct a simulation on the predator-prey. For this experiment, I have to investigate the effect of population predator if the parameter of prey was manipulated.
DATA & DISCUSSION
NORMAL

NUMBER OF LYNX=100

Nextly, the parameter was change up to 100 population. After click ‘RUN’, the graph show up and down. The red line represent population of prey, lynx while blue line represent predator, hares means that, if the population of the lynx increases, the population of hare will decreases.
NUMBER OF LYNX =300
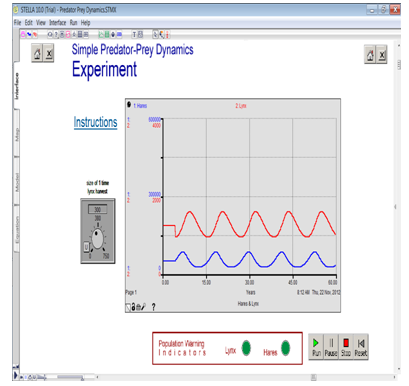
After that, the parameter was change to 300 population of lynx. The graph shows it follows the concept of predator-prey. After click ‘RUN’, the graph show up and down. The red line represent population of prey, lynx while blue line represent predator, hares. It means that, if the population of the lynx increases, the population of hare will decreases.
NUMBER OF LYNX = 500

Predation is used here to include all positive and negative interactions in which one organism consumes all or part of another. This include predator-prey, herbivore-plant and parasites –host interaction. These linkage are prime movers of energy through food chains. They are an important factor in the ecology of populations, determining mortality of prey and birth of new predators. A predator is an organism that eats another organism. The prey is the organism which the predators eat. Some examples of predator and prey are lion and zebra, bear and fish and lynx and hares. The words “predator” and “prey” are almost always used to mean only animals that eat animals, but the same concept also applies to plant such as rabbit and lettuce and grasshopper and leaf.
Predator and prey evolve together. The prey is part of the predator’s environment, and the predator dies if it does not get food , so it evolves whatever is necessary in order to eat the prey such as speed, stealth, camouflage, a good smell, sight or hearing that to find the prey and poison to kill the prey. Likewise, the predator is part of the prey’s environment, and the prey dies if it is eaten by predator, so it evolves whatever is necessary to avoid being eaten; speed, camouflage is to hide from predator, a good sense of smell, sight, thorns and poison to spray when approached or bitten.
For an example, the fastest lion are able to catch food and eat, so they survive and reproduce, and gradually, faster lions make up more and more of the populations. The fastest zebras are able to escape the lions, so they survive and reproduce and gradually. The faster zebras make up more and more of the population. An important thing to realize is that as both organisms become faster to adapt to their environments. Their relationship remains the same because they are both getting faster neither getting faster in relation to the other. Thus, this is true in all predator-preys relationship. Another example of predator-prey evolution is that of the Galapagos tortoise. Galapagos tortoise eat the branches of the cactus plants that grow on the Galagapos islands. On the island, which long-necked tortoise live, the branches are higher off the ground. On the another island, where the short necked tortoises live, the branches are lower down. The cactus, the prey may have evolved high branches so that the tortoises, the predator can’t reach them.
Based on the data experiment, lynx is an example of predator while hare is prey. Based on the graph, when predator are numerous, it causes their prey decreases in numbers. When reducing the predator population, which in turn causes prey number to increases. After some time, the cycle repeated. Predator-prey cycles are characterized by regularly spaced increases and decreases in the population sizes or densities of a predator and its prey. Classically, the predator is a carnivorous species and the prey is an herbivorous species. The predator population’s fluctuations follow those of the prey population through time. That is, the prey populations begin to increase while the predator population is still decreasing and the prey population decreases while the predator population is still increasing. The simplest explanation of these cycles is the predator drives the change in the prey population by catching and killing its members, while the prey as the predators’s food supply. The prey drives the changes in predator’s population changes. A lag between the population responses of predator and prey causes the two cycle to be out of phase with one another.
Population cycles, in which the population increases and decreases repeatedly, at more or less regular intervals, have been at the centre of the attempt to understand population fluctuations. Cycles are useful because the change can be anticipated with some confidence and more changes may occur in a given time period than in an irregularly fluctuating population. Based on the graph, when the predator population declines, thus the prey available to sustain its growth and the prey population decreases because there are too many predators to stop its growth. Actually, more prey are left alive because fewer predators are catching, killing and eating fewer of them, but to increase in numbers, the prey must reproduce, and that takes time so there is a lag in the response of each population to the changes that take place in the other. Increasing numbers of predator or prey result in delayed responses in the opposite population for similar reasons.
Overall from the four graph, it can increases student motivation by give the chances the students to explore the model of simulation. Before they start conduct experiment simulation, make sure they read and understand the concept of predator-prey. After that, when they understand, they can conduct the simulation. Firstly, they do not have to change the parameter because they can differentiate the normal graph and graph by changing parameter. Thus, at the same time, they must feel excited to know more deeply about this experiment. Besides, they must happy during do this experiment because it will do in a group. If we in a group, we feel excited and enjoy to learn something new. When students connected with other students they expressed feeling happy, important, and relaxed. Learning was simply more fun when they got to learn with another person. The two specific ways in which students experienced this connection were through a sense of belonging and honored voiced. Nextly, by performing this simulation, it just like learning through play-like activities and it involve students to more active. It is because, from a student perspective, active involvement is the first ingredient for experiencing fun. Sitting and listening throughout the day produces boredom and withdrawal of in students. In contrast, activities that actively engage students result in enriched learning experiences, willingness for students to exert effort, and usually a more authentic approach to academics.
Futhermore, from performing simulation, students can make prediction. For example, when they read and understand the background and theory of the experiment, they can make earlier prediction that what they have to do. For the starting, they do not have changing the parameter. So, for the first reading, they can’t make any prediction because the graph move smoothly. Nextly, the parameter population of lynx must change up to 100, 300 and 500. Thus, from this three graph, they start to understand and make prediction that if number of lynx increases, the number of hare will decreases. So, for this case, from simulation it can create and makes students to thinking and can make earlier prediction about the results that they will get.
CONCLUSION
As a conclusion, simulations have the potential to enhance the way the teachers teach and students to learn. The simulation brings the most abstract concepts to life of students and incorporate otherwise impossible or impractical experiences into daily instruction. Besides, computer simulations are potentially useful for simulating labs that are impractical, expensive, impossible or too dangerous to run. Simulations can contribute to conceptual change, provide open-ended experiences and provide tools for scientific inquiry and problem solving. It also have potential for distance education. Then, the success of computer simulations use in science education depends on how they incorporated into curriculum and how teacher use it. The most appropriate use of computer simulations seems that use them for a supplementary tools for classroom instruction and laboratory. Computer simulations are good tools to improve students’ hypothesis construction, graphic interpretation and prediction skills.
Technology has developed in response to man's needs to solve problems and make life easier. Integrating technology in the classroom can facilitate learning and address many educational issues. Schools aim to provide effective educational opportunities for all students. Investing in computer technology at school supports the idea of students centered learning. Integrating technology in the classroom may be a solution but it is also the problem. Classrooms have changed in appearance. The learning environment is no longer reflected by frontal teaching where the teacher is actively engaged up front and the student is passively seated. Organizing and managing a technology enhanced classroom is not easy. Teachers need to be creative with the skills of a manager and technology expert to guide students to identify, select and use the most appropriate technology tools for all kinds of learning activities.
Subscribe to:
Posts (Atom)